Creating Charts
Updated Jan 24th, 2023
Who is this guide for?
Case Management Supervisors, System Supervisors and Report Writers
Getting started
This guide will assist you with creating charts in your custom reports. The guide assumes that you have already created a report which is suitable for creating a chart from. If you do not yet have such a report, then we recommend you first follow the course The Report Writer.
For the purposes of this guide, we have already created a Source report, showing the total number of client matters introduced to us by a particular referrer. We will use this report to create a chart.
Opening your existing report
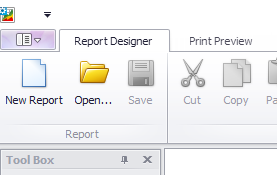
Open the report designer and log in. Click the Open button on the top ribbon and locate your report.
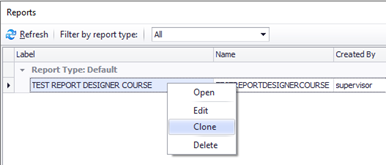
Right click your report and choose Open/Edit/Clone. We will choose Clone to create a copy of the report.
An identical copy of your original report will open. You may save this now if you wish with a new name.
Placing your chart
Now our report is open, we need to decide where to place the chart.
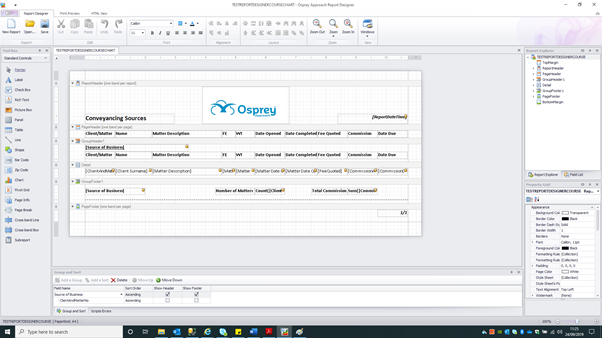
We can either put it at the beginning of the report, or at the end. We will place ours in the report header so that it appears on the first page of the report.
Expand the Report Header to make it large enough to insert your chart.
Now, select the Chart icon from the Toolbox on the left hand side and drag it into the Report Header. The Chart Wizard will open automatically:
You may now choose an optional type of chart, Pie or Bar.
Option 1 – Create a Pie Chart
In this example, we will be creating a Pie Chart to display the total number of matters introduced by each referral source or introducer.
Select Pie Series from the Chart Type drop down list, then the style of Pie Chart you would prefer. Click Next.
If you wish, you may now choose a colour palette and style for your chart:
Select the Data option from the Construction section on the left hand panel, then the Auto-Created Series tab. Select Data Member drop down list and double click your report view name:
Select the Series Binding tab. In the Argument Properties section, select and double click your Source of Business field in the Argument box. This tells the graph which field we are counting.
In the Value Properties box set the Binding Mode to Summary Function – this tells the report to give us the total for each source of business, and in the summary function, select Count. This tells the report to Count the number of entries to find per source.
Click Finish. Select the Print Preview tab and run your report.
There are 7 matters for the report. 1 from Advert, 2 for Estate Agent, 2 from the newspaper, and 1 each for Recommendation and Yellow Pages. This graph type defaults to showing you as a percentage of the whole:
We can now change the graph to show the actual number of matters per source rather than percent, and have the legend and data points show the name of each source alongside them.
Return to the Report Designer ribbon tab and click the > button in the top right hand corner of the chart. Select Run Wizard. Select the Series menu on the left, then the Point Options tab on the right hand side. Set Point View to Argument and Values. Untick Value as Percent. Now click Finish, then Print Preview your report again. The legend and the graph now have labels and a count of the matters.
You can experiment with the other options in the Chart Wizard. Further help can be found at:
Option 2 – Create a Bar Chart
In this example, we will be creating a Bar Chart to display the total commission received by each referral source or introducer, along with the number of matters they have introduced. Please note that if numeric sum values are required in your chart, then the report must be based on a stored procedure rather than a view (contact support if you are unsure of this).
Select Bar Series from the Chart Type drop down list. Select the style of Bar chart you would prefer, then click Next.
You may now choose a colour palette and a Style if you wish, then click Next:
Select the Data option from the Construction section on the left hand panel, then the Auto-Created Series tab.
Select Data Member drop down list and choose your stored procedure name:
Select the Series menu. You should find that two Series have been added by default. Each Series represents the data that we want to count. We can rename them to make it easier to navigate the wizard.
Rename Series 1 to Commission Received.
Rename Series 2 to Matters Introduced.
Navigate to the Data menu, Series Binding tab.
Against the Commission Received Series, in the Argument Properties box, set the Argument to Source of Business – this tells the report we are looking at data BY source of business. In the Value Properties box, set the Binding mode to Summary Function, and set the Summary Function box to SUM(Introducer Commission). This tells the report that for each source of business from the argument box above, we want to see the sum of Introducer Commission.
Against the Matters Introduced Series, in the Argument Properties box, set the Argument to Source of Business – this tells the report we are looking at data BY source of business. In the Value Properties box, set the Binding mode to Summary Function, and set the Summary Function box to COUNT(). This tells the report that for each source of business from the argument box above, we want to see the count of matters or rows.
For both series’, navigate to the Point Options tab and change the Point View to Argument and Values. Untick Value as Percent.
The graph should now look something like this:
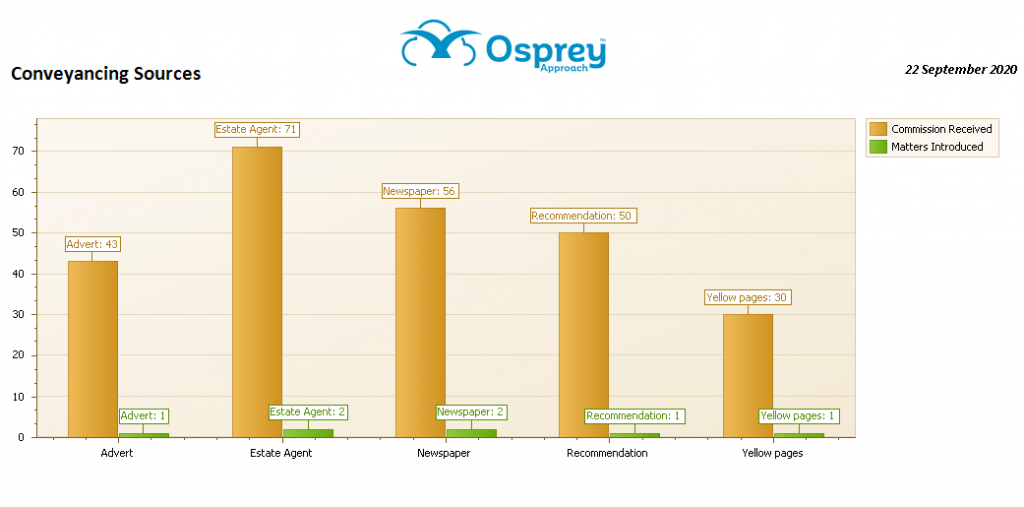
There are 7 matters for the report, 1 each for Advert, Recommendation and Yellow Pages, and 2 each for Estate Agent and Newspaper. These are shown on the chart in green, and the commission received totals for each source are shown in orange.
You can experiment with the other options in the Chart Wizard. Further help can be found at: