Create a Custom Report
Updated Apr 16th, 2024
Who is this guide for?
System Supervisors and Report Writers
You can use the Osprey Report Designer to create customised reports. In order to create a new report, you will need to install the Report Writer software.
To see the videos in this guide, you can click to enlarge them.
Log in and choose a Data Set
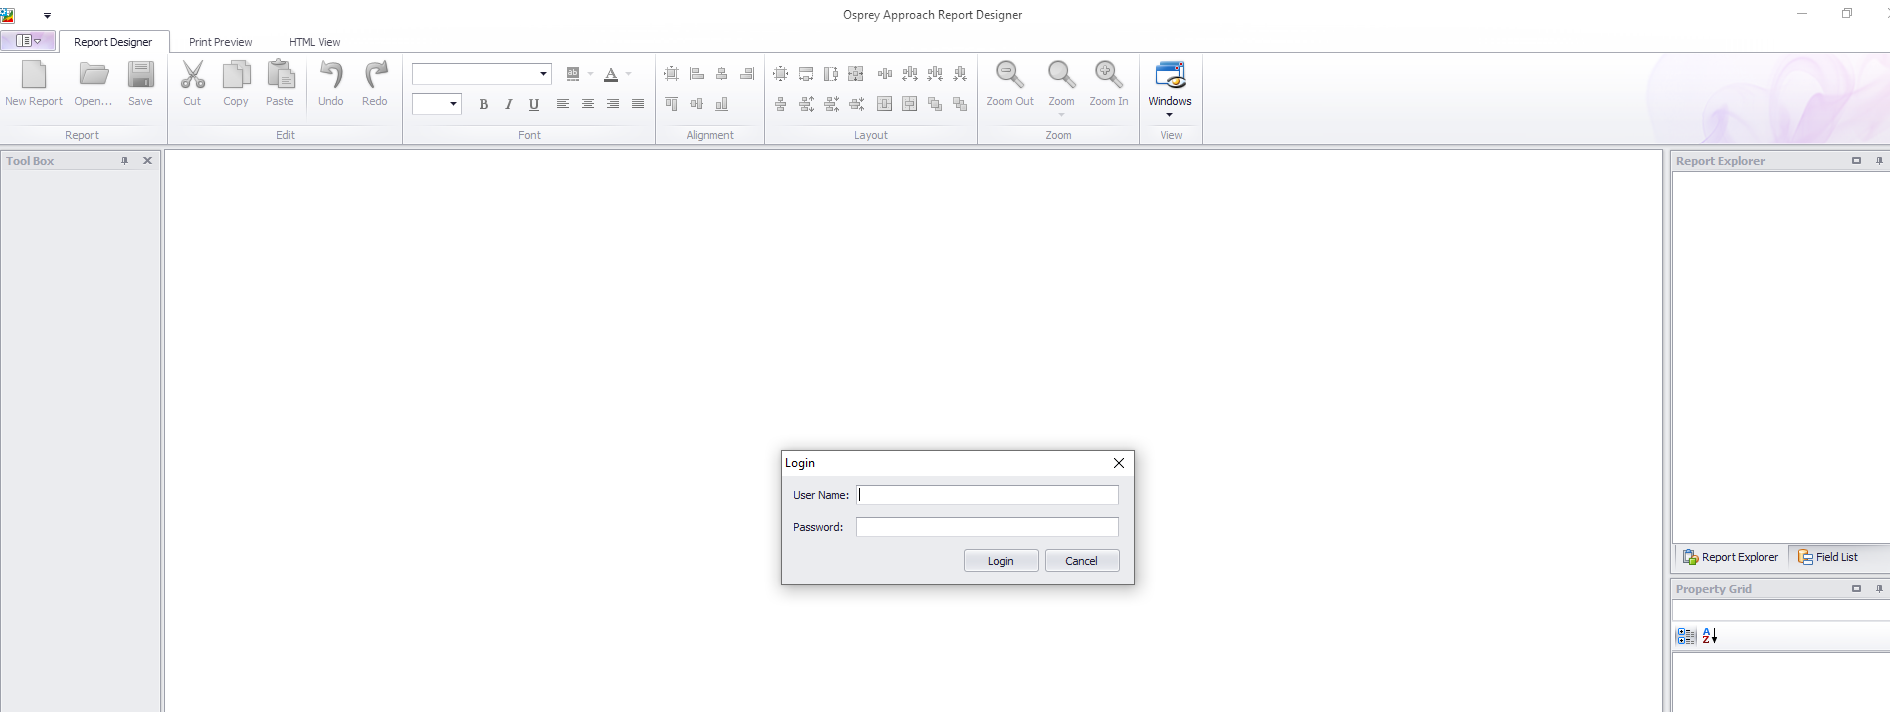
When using the Report Designer for the first time, you will be prompted to enter the URL for your Osprey database e.g. https://<YOURFIRMNAME>.ospreyapproach.com/main. Once this is entered, you will be prompted to log in. These will be the same details as your Osprey user, which will need to be linked to the Supervisor template in order to log in.
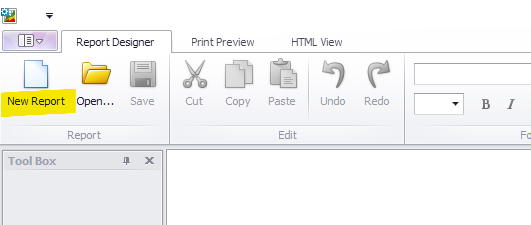
Click on the New Report button:
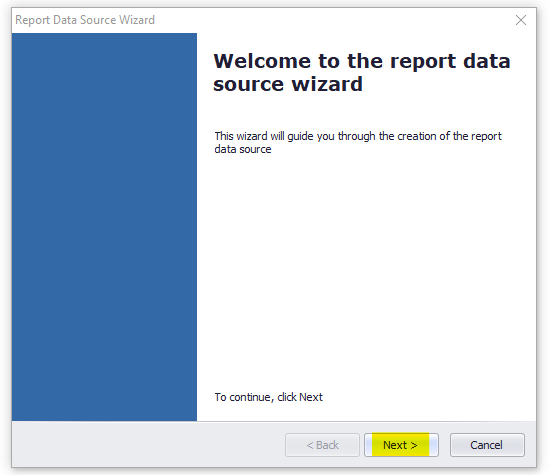
This will open the Report Data Source Wizard. Click Next:
The Database Objects screen will open.
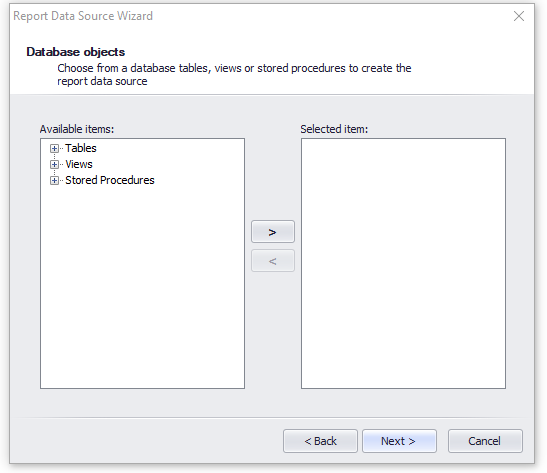
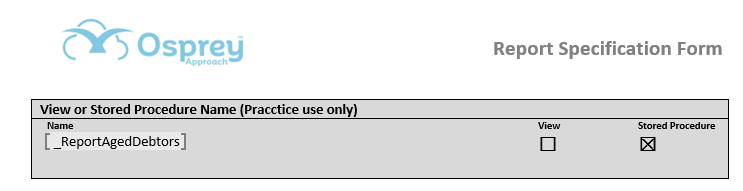
If you have filled in one of our report specification forms, we will have returned it to you with the name of the view or stored procedure marked in the top of the form, and indicated whether it has been created as a view or a stored procedure. Expand the relevant section, and select the view, stored procedure or table you want to use to create your report. Only one object can be selected to create your report.
e.g. in the below form, a Stored Procedure called _ReportAgedDebtors has been created:
Expand the Stored Procedures section, and select _ReportAgedDebtors. Use the chevron > button to move _ReportAgedDebtors to the Selected Item panel.
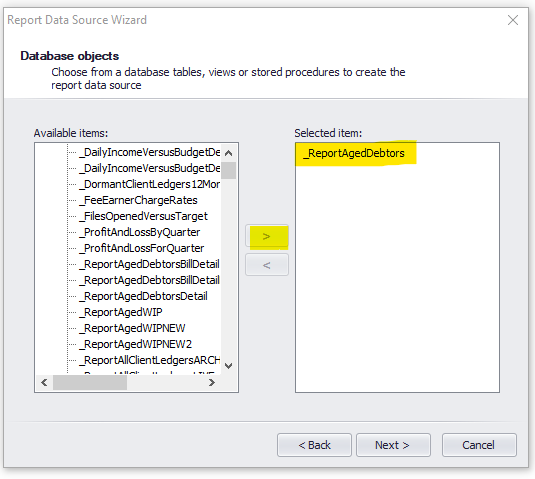
Click Next, and then Finish. A blank report linked to the selected data set will now be created.
Change the paper size, orientation, margins and preferred font
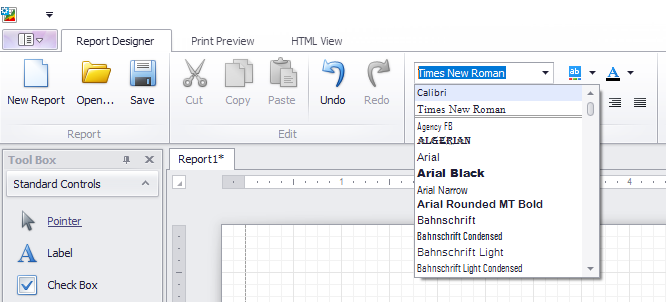
The report designer defaults to Portrait and Letter size, with a Times New Roman font. For best results when printed, you will need to change the paper size to A4. Depending on the number of columns and amount of data you want to display, you can also change the layout to Landscape. If you have a preferred font, setting it now will save time as you create your report.
Navigate to the Property Grid in the bottom right hand corner of the report designer, and scroll down to Page Settings. Set the values as required:
Now, select your preferred font from the ribbon at the top of the screen:
The light grey dotted lines show the margins. These can be made narrower if required.
Add a title to your report
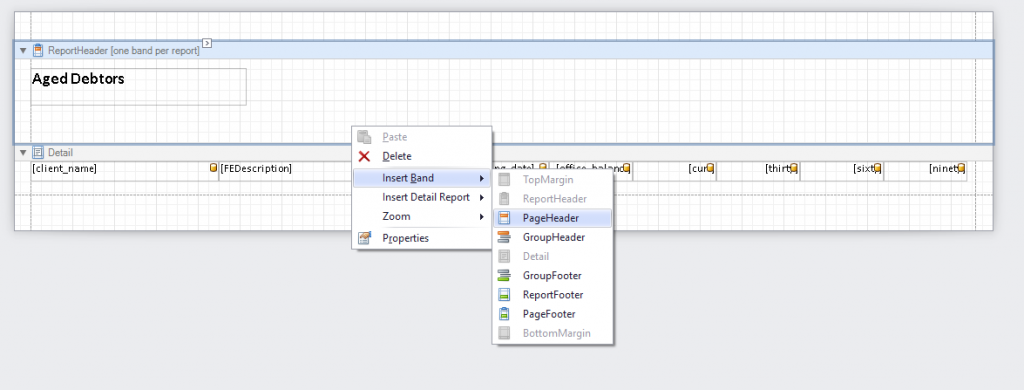
To add a title which will appear on every page, use a Page Header, or for one which only appears at the top of the report, use a Report Header.
Right click on your report, select Insert Band, and select the type of header you want to use:
You can now add the title for your report by selecting the Label option from the Standard Controls box on the left hand side, and dragging it into position in the Report Header area. Double click to edit the label, type the text you want to appear and then click elsewhere to save (pressing return/enter will add a carriage return after your text!). You can then format the heading if you wish, and resize it by dragging the square dot buttons around it.
Insert data fields
It is a good idea to insert your data fields and then preview the report prior to adding the column headings, as you can then adjust the width of your fields prior to adding column headings of the same size, rather than having to resize both later on.
To insert a field, drag it from the Field List on the right hand side of the designer into the Detail area on your report:
Preview your report
At any time during the process you can see how your report will display by using the Preview option located in the top left of the designer. This will enable you to determine whether any of you fields need formatting or resizing.
Format fields
By default, all date fields in SQL Server are displayed with a timestamp, and all money fields will have four decimal places. You can change the display by formatting the fields. To do this, select the field you wish to format, then click the little chevron > button in the top right corner. Click the ellipsis … button on the end of the Format String box and select the style of format you’d like to use, then the format. You can add custom formats too.
Add column headings
Now that you have your data fields added and sized accordingly, you can create your column headings. This is done in the same way as the report title earlier, only this time we’re going to want them in the Page Header area to ensure they appear at the top of every page. If you haven’t already added a Page Header band, you can do so by right clicking your report and selecting Insert Band > Page Header:
You can now drag your labels into the page header and overtype them as you did with the report title, resizing them to match the fields.
Save your report
You can create your own custom areas in which to save the reports you have build. In the Osprey Browser app, navigate to the Supervisor area > Report Setup > Report Type. You can add a new group in here.
Now that you have created your group, you can save your report to it. Back in the report designer, click the Save button, select your newly created group or choose one of the other groups, and enter a Name (cannot have any spaces or special characters) and a Label (can have any text). The description is optional but can be useful if you plan to create several copies of the report with different groupings for example.
Sort and Group your report, and add subtotals
You can ensure the sort order of your report, or add subtotals for a group of data by using the Group and Sort panel at the bottom of the report. In this example, we will group the report by work type to add subtotals, and sort the matters by client/matter number within each work type.
In the Group and Sort panel, you will have two options:
- Add a Sort – selecting this will simply sort the data in the order you specify.
- Add a Group – selecting this also sorts the data in the order you specify, but will automatically add a Group Header band. This can however be removed if required to revert the option back to a Sort.
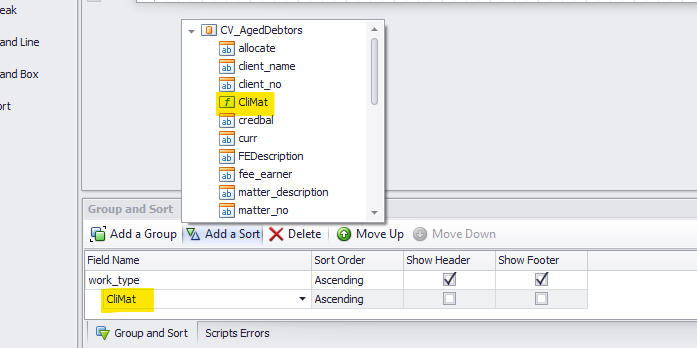
From the Group and Sort panel at the foot of the report designer, select Add a Group. Select the field you wish to group by, and choose between Ascending (alphabetical A – Z or numerical 0 – 9) or Descending (alphabetical Z – A or numerical 9 – 0). The Show Header box will be ticked by default. If you wish to add a Footer for the group in which to display subtotals, tick the Show Footer box. You can hide the header if you do not wish to use it:
You can use the Group Header to display the name of the group if you wish, then copy the fields you wish to subtotal down into the Group Footer ready to be converted to their corresponding subtotals.
To convert the new fields into subtotals, select them one by one, clicking the chevron > button in the top right hand corner of the field. Click the ellipsis button in the Summary box, select Sum in the Summary Function box as we want to see a sum of the monetary values, and Group in the Summary Running box as we want to see these subtotals at the end of each Group. Apply any formatting that you want to the field:
And now, to ensure that within each work type, the data is sorted into client and matter number order, click Add a Sort in the Group and Sort panel at the foot of the page, and select your Client and Matter No field, or add Client No and then Matter No as independent sorts:
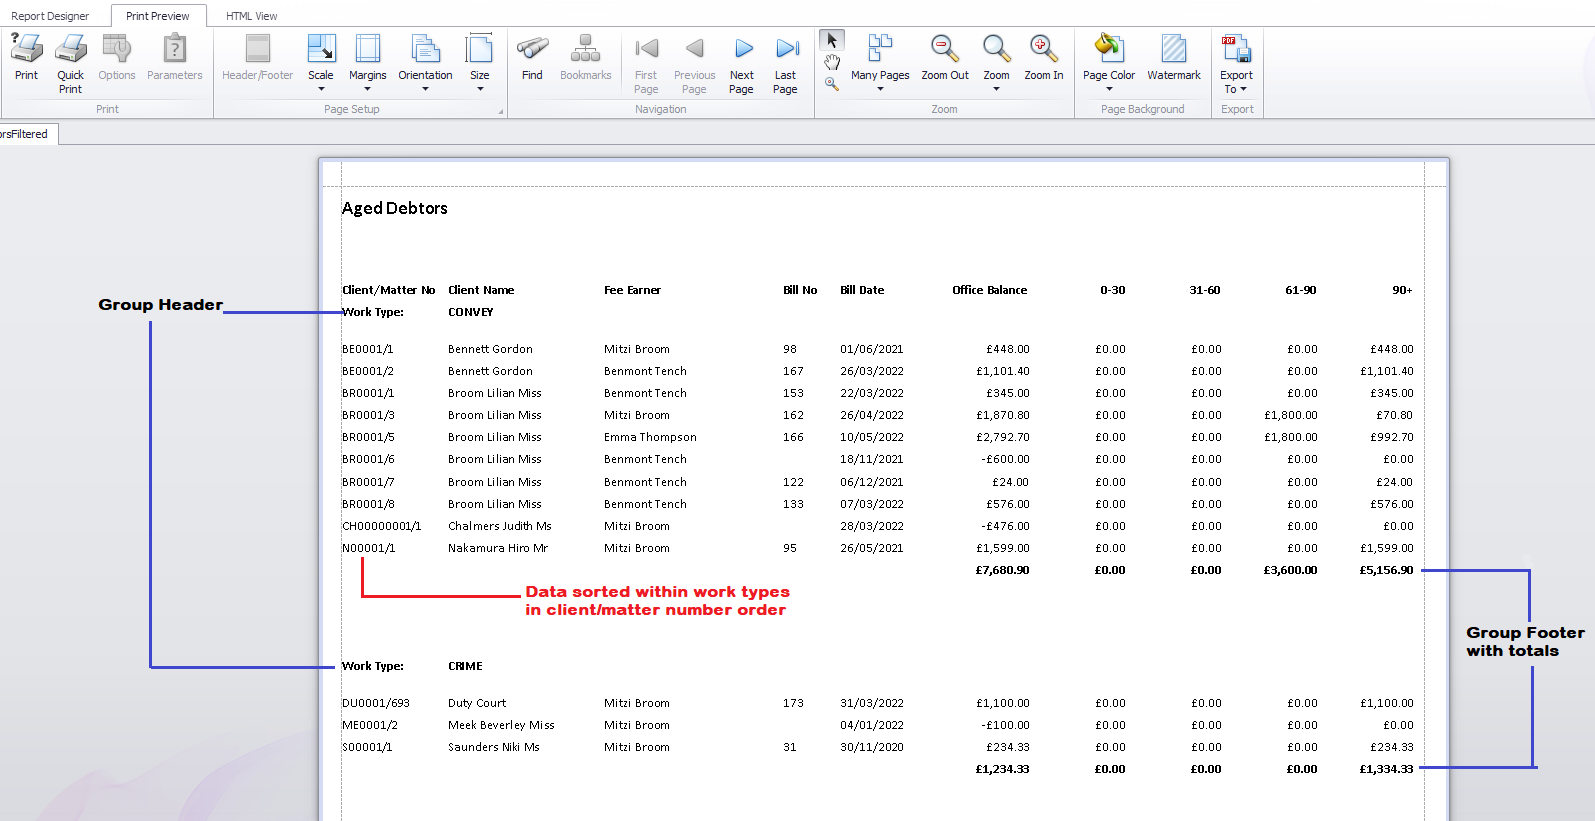
Preview your report again:
Add Filters to your report
If you are not planning to schedule your report to run automatically, and provided your report is not based on a Stored Procedure data set, you can add filters to enable you to just see a certain portion of the data.
If your data set is a Stored Procedure, please contact the support team to assist with adding any filters you require.
If you are planning to schedule your report to be emailed to staff regularly, it cannot have any filters on it. Should you wish to refine the data for scheduled reports, please call our support team to discuss.
To add a filter, you will first need to add a Parameter – this will create a box which the user can enter values into when running the report in Osprey. From the Field List box in the top right of the report designer, scroll down and right click the Parameters area located at the bottom of the Field List, then select Edit Parameters:
Click the Add button. On the right hand side of the Parameter Collection Editor, give your parameter a description – this will be the description of the filter that the user will see when they run the report. Choose a Type for the parameter. The most regularly used types are listed below:
- String – provides a text box which can be used to compare user input in the filter to data in the report. E.g. Client County begins with “H” would bring through all clients where the clients’ home county begins with H (Herefordshire, Hertfordshire, Hampshire)
- DateTime – provides a calendar function to select a date or a range of dates between which to filter data. E.g. Matter Date Opened is greater than or equal to 01/01/2022 would bring through any matters which were opened on or after 1st January 2022.
- Boolean – provides a tick box filter Yes/No. E.g. Matter is a Prospect? Tick to see prospects or leave unticked to see just live matters.
- Fee Earner – provides a drop down list box of all your In Use fee earners.
- Work Type – provides a drop down list box of all your In Use work types.
- Branch – provides a drop down list box of all your In Use branches.
- Department – provides a drop down list box of all your In Use branches.
- Franchise – provides a drop down list box of all your In Use franchise categories.
- User – provides a drop down list box of all your In Use Osprey users.
- Currency – provides a drop down list box of all your In Use currencies.
- Bank – provides a drop down list box of all your In Use banks.
- Journal – provides a drop down list box of the Journal accounts in Osprey, Petty Cash, Debtors, VAT Journal, Write Offs etc.
- Private / LA – provides a drop down for All (All matters) / P (Private Only) / L (Legal Aid only)
Now give the parameter a name so that you can distinguish it (the parameter Name must have no spaces). Click OK when done, or repeat steps above to add more filters.
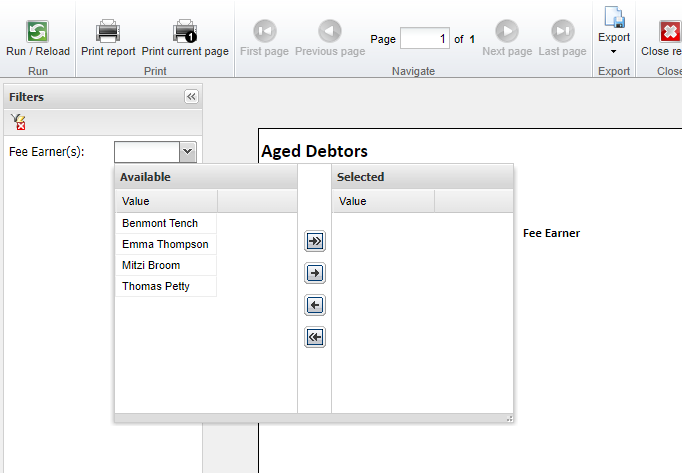
The filter will now appear when the report is run in Osprey:
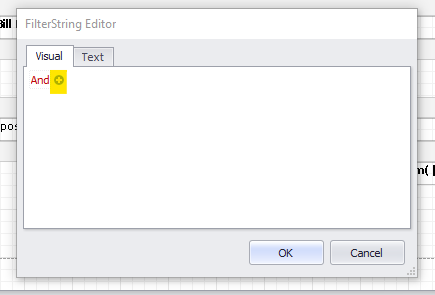
We now need to tell the report what to do with this user input once it has been selected. Locate the small button positioned in the top left corner where the horizontal and vertical rulers meet and click it, then click the ellipsis button in the Filter String box to open the Filter String Editor:
All of your parameters will need to be linked in here so that the report knows how to compare what the user has entered at runtime with the relevant data in Osprey.
Click the + button:
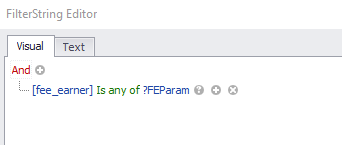
The Filter String Editor is made up of three parts:
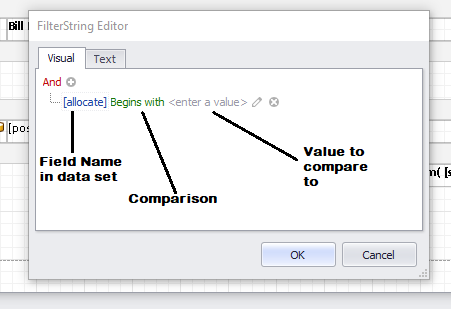
For our Fee Earner example, we will select the fee_earner from the Field Name box. In order to allow users to select one or many fee earners from the list, we will choose Is Any Of in the Comparison box. We will then select our FEParam parameter from the Value to Compare box:
The most commonly used Comparison operators are described below. For more information on Parameter Functions please click here:
- Equals – only records where the data exactly matches the user input will be returned.
- Is greater than/is greater than or equal to – useful for date fields, e.g. a bills rendered report where the bill date is greater than or equal to the date the user enters.
- Is less than/is less than or equal to – as above example, can be used to create a Date From / Date To filter in conjunction with greater than or equal to.
- Is Like – can be used to create a filter box where the user can enter % as a wildcard, e.g. Client Surname Is Like %son% would pull through any clients where the surname contains the letters “son” somewhere.
- Is blank / Is not blank – useful for use with matter archive date for example. Matter Date Archived Is Blank would pull through all live matters, whilst Matter Date Archived Is not Blank would pull through all archived matters.
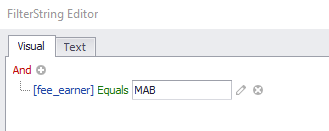
The Value to Compare box can be used in three ways:
- Default – Manually type in a value – e.g. fee_earner Equals MAB would result in only matters belonging to the fee earner with the initials MAB being returned.
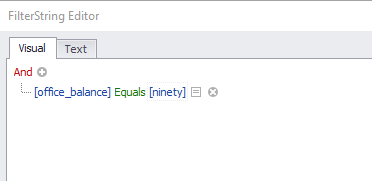
- Click the pencil icon – Compare one field to another field – e.g. selecting office_balance Equals ninety would just show the Aged Debtor records where all of the debt in the office balance is ninety or more days old.
- Click the paper icon – Compare a field to a Parameter you have added – e.g. as above, the Fee earner in the data is the same as any of the values the user has selected from the fee earner parameter box. Parameters will always begin with ?
Run your report in Osprey
To run your report in Osprey, log in to the browser app and navigate to Reports > Reports (New). You can use the search option to search for your group or report name, and then double click the report to open the filter screen in a new tab. Enter any filters required, and then click the Run/Reload button. Reports can be exported to PDF or Excel.
Parameter Functions
| Function | Description |
|---|---|
| Equals | Allows you to filter for an exact data match to the value you enter into the filter box |
| Does not equal | Allows you to filter for data which does not equal the value you enter into the filter box |
| Is greater than | Use for numbers or dates – report will show data where the field selected is greater than the value you enter |
| Is greater than or equal to | Use for numbers or dates – report will show data where the field selected is greater than or equal to the value you enter |
| Is less than | Use for numbers or dates – report will show data where the field selected is less than the value you enter |
| Is less than or equal to | Use for numbers or dates – report will show data where the field selected is less than or equal to the value you enter |
| Is between | Use for numbers or dates – report will show data where the field selected is between the values you enter |
| Is not between | Use for numbers or dates – report will show data where the field selected is not between the values you enter |
| Contains | Use for text – report will show data where the field selected contains the word or characters you enter in the filter box |
| Does not contain | Use for text – report will show data where the field selected does not contain the word or characters you enter in the filter box |
| Begins with | Use for text – report will show data where the field selected begins with the word or characters you enter in the filter box |
| Ends with | Use for text – report will show data where the field selected ends with the word or characters you enter in the filter box |
| Is like | Use for text – report will show data where the field selected contains the word or characters you enter in the filter box, use with wild card % |
| Is not like | Use for text – report will show data where the field selected does not contain the word or characters you enter in the filter box, use with wild card % |
| Is blank | Report on records where the field selected is blank or empty e.g. Matter Date Archived Is Blank would return all live matters |
| Is not blank | Report on records where the field selected is not blank e.g. Matter Date Archived Is Not Blank would return all archived matters |
| Is any of | Use with Fee Earner/Work Type filters for example, where a list is required. e.g. Matter Fee Earner ID Is Any Of ?FeeEarner would allow you to select one or many fee earners to filter the report by |
| Is none of | Use with Fee Earner/Work Type filters for example, where a list is required. e.g. Matter Fee Earner ID Is None Of ?FeeEarner would allow you to exclude the chosen fee earners from your report |